News
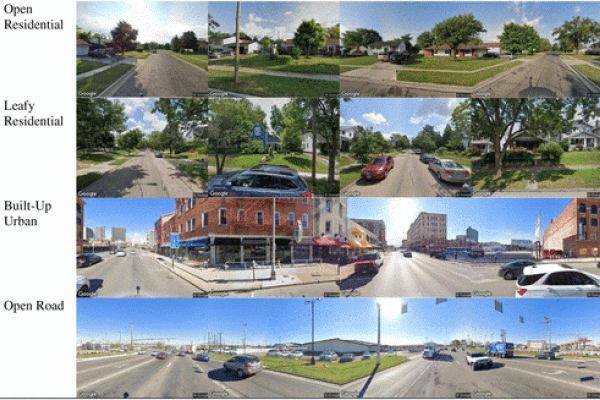
How does street space influence crash frequency? An analysis using segmented street view imagery
A new paper co-authored by CURA director, Harvey Miller, has been published in the Journal of Environment and Planning B: Urban Analytics and City Science.
Abstract: Road…
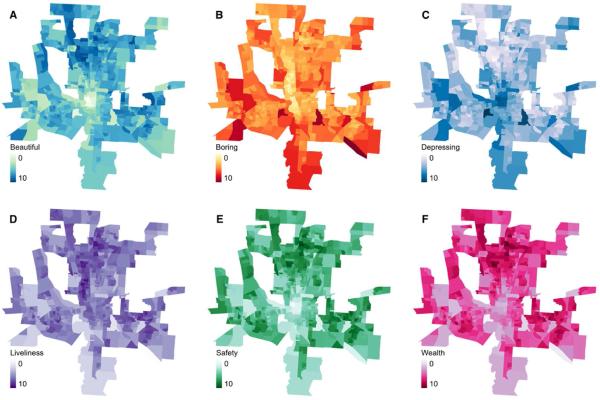
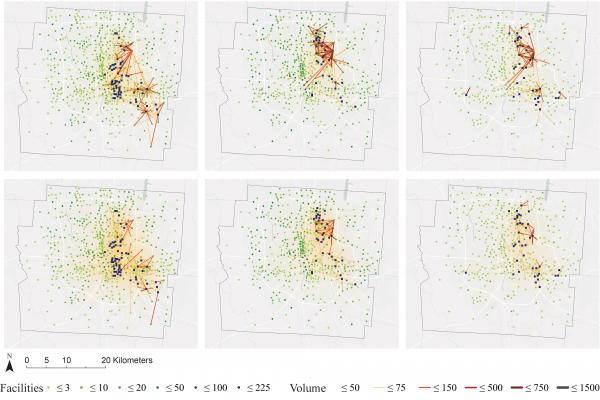
Understanding the role of urban social and physical environment in opioid overdose events using found geospatial data
A new article co-authored by CURA director, Harvey Miller, has been published in the journal Health & Place. This study looked at how the opioid health crisis in Franklin County is spatially…
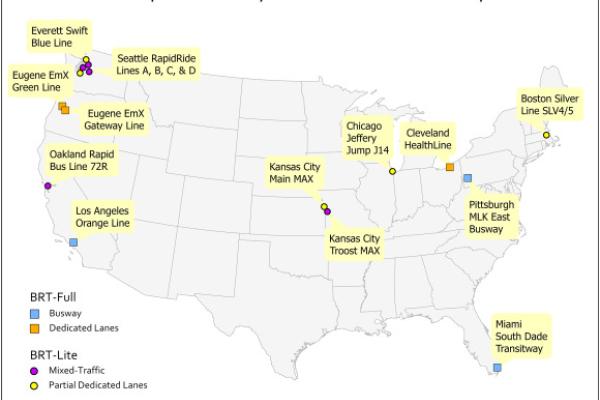
Impacts of bus rapid transit (BRT) on residential property values: A comparative analysis of 11 US BRT systems
A new article co-authored by CURA director, Harvey Miller, has been published in the Journal of Transport Geography. This study fills substantial gaps in the literature about the impact of BRT on…
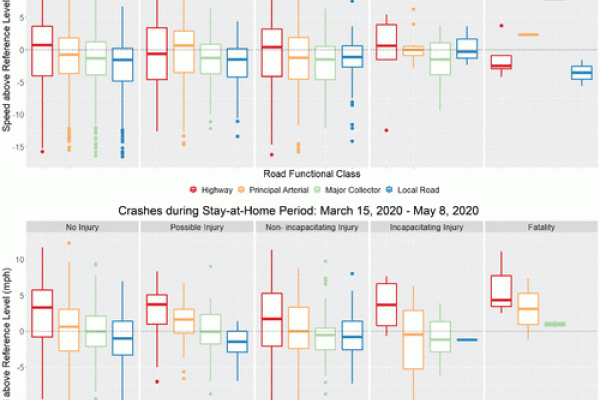
Lower Volumes, Higher Speeds: Changes to Crash Type, Timing, and Severity on Urban Roads from COVID-19 Stay-at-Home Policies
A new article co-authored by CURA's Director Harvey Miller and former CURA Graduate Research Associate Jinhyung Lee has been published in the journal Transportation Research Record.…
What Is Essential Travel? Socioeconomic Differences in Travel Demand in Columbus, Ohio, during the COVID-19 Lockdown
This week, an article was published in the journal Annals of the American Association of Geographers co-authored by CURA Director Harvey Miller. This study focused on the…
Who still needs public transit during the pandemic? Essential workers, minorities, and seniors
By: Luyu Liu, Harvey J. Miller
Background
COVID-19 became a global pandemic due to its contagiousness, fatality rates, and lack of effective…
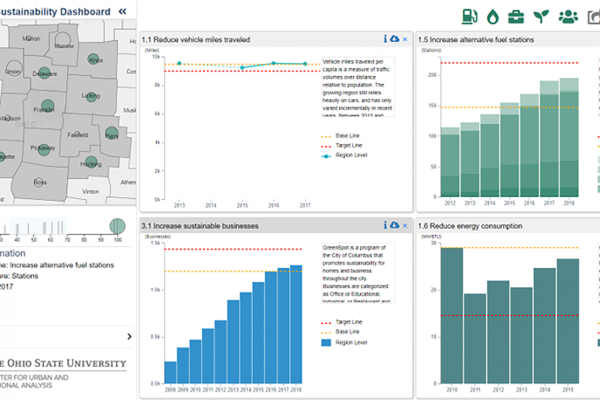
Regional Sustainability Dashboard
CURA and The Mid-Ohio Regional Planning Commission (MORPC) are launching an interactive, online dashboard that provides current and accurate information on Central Ohio’s sustainability…
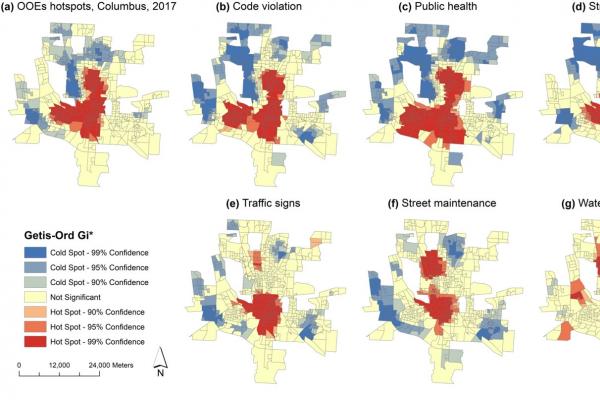
311 calls may predict opioid overdose hotspots
By: Yuchen Li, Ayaz Hyder, Lauren T. Southerland, Gretchen Hammond, Adam Porr & Harvey J. Miller
Background
Opioid use disorder and overdose deaths…
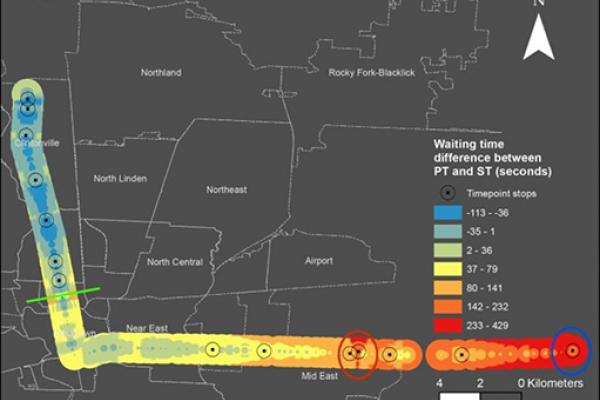
Does real-time transit information reduce waiting time? Probably not
By: Luyu Liu, Harvey J. Miller
Background
A common belief about real-time information (RTI) is the reduction of waiting time by allowing passengers…