311 calls may predict opioid overdose hotspots
By: Yuchen Li, Ayaz Hyder, Lauren T. Southerland, Gretchen Hammond, Adam Porr & Harvey J. Miller
Background
Opioid use disorder and overdose deaths is a public health crisis in the United States and there is increasing recognition that its etiology is rooted in part by social determinants such as poverty, isolation and social upheaval. Limiting research and policy interventions is the low temporal and spatial resolution of publicly available administrative data such as census data. We explore the use of municipal service requests (also known as “311” requests) as high resolution spatial and temporal indicators of neighborhood social distress and opioid misuse.
Results
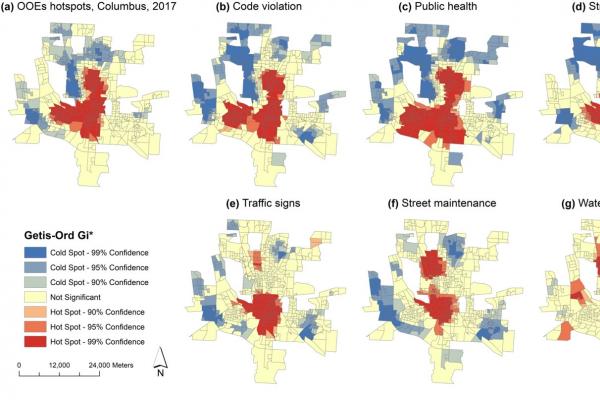
We analyze the spatial associations between georeferenced opioid overdose event (OOE) data from emergency medical service responders and 311 service request data from the City of Columbus, OH, USA for the time period 2008–2017. We find 10 out of 21 types of 311 requests (abandoned vehicles, animal complaints, code violation, law enforcement, public health, refuse trash litter, street lighting, street maintenance, traffic signs, and water sewers drains) spatially associate with OOEs and also characterize neighborhoods with lower socio-economic status in the city, both consistently over time. We also demonstrate that the 311 indicators are capable of predicting OOE hotspots at the neighborhood-level: our results show code violation, public health, and street lighting were the top three accurate predictors with predictive accuracy as 0.92, 0.89 and 0.83, respectively.

Figure (a) shows the actual spatial distribution of OOE hot spots and cold spots in Columbus, 2017. The remaining maps show the three most accurate predictors based on predict accuracy: code violation (b), public health (c) and street lighting (d). Figure also shows the three most inaccurate predictions: traffic signs, street maintenance, and waters sewers drains in Fig. e–g, respectively. (Li et al., 2020)
Implecations
The results from this study support the view that opioid crisis is rooted in social and neighborhood distress. We show such spatial characteristics can be used along with 311 data itself to predict the trends of opioid overdose hotspots when OOEs data is not available. Since 311 requests are publicly available and with high spatial and temporal resolution, they can be effective as opioid overdose surveillance indicators for basic research and applied policy. It is worth mentioning that our research is not a predictive policing tool. An appropriate use is to help think strategically about where to allocate outreach, programs and resources to at-risk individuals and how to alleviate the underlying social and environmental stressors in our city.
Reference: Li, Y., Hyder, A., Southerland, L. T., Hammond, G., Porr, A., & Miller, H. J. (2020). 311 Service Requests As Indicators of Neighborhood Distress and Opioid Use Disorder. Scientific Reports, 10(1), 1–11. https://doi.org/10.1038/s41598-020-76685-z
Check out the full academic article in the link below!