CURIO Dashboard
The main CURIO dashboard is getting some refreshment!
While you're waiting, check out the associated apps at the links below.
The Columbus Urban and Regional Information Observatory, also known as CURIO, is one of CURA's flagship projects. CURIO is a web application that brings together spatio-temporal information about Columbus and the surrounding region from a variety of sources and presents the information to the user in intuitive and insightful ways. The data is thoughtfully curated to provide a near-realtime snapshot of the social, economic, infrastructural, and environmental fabric of the city. CURIO consists of the following features:
Dashboard (temporarily suspended)
The landing page for CURIO is the dashboard itself, which features an interactive map of the Central Ohio area and a variety of interactive charts displaying urban data such as:
- COGO bikeshare stations and realtime bike availability
- Key demographics from the U.S. Census
- Tweets, including origin and topic
- Air quality measurements from several stations
- Traffic camera photos from a variety of locations, updated in near realtime
- Driving trip durations for several representative trips over the past 24 hours
- Buses, including the quanity in operation and their realtime locations for the past 24 hours
- Aggregate bus delays by route type for the past 24 hours.
Map gallery

The Map Gallery provides an interactive web map that can be customized by overlaying layers representing a variety of categories including points of interest, transportation, demographics, and environmental features. Not finding the layer you want? You can even add your own!
Transit delay visualization tool

The transit delay visualization tool allows the user to review (and playback) realtime bus location data in 6-hour increments and to visualize the cumulative delay (by bus line and in aggregate) over the course of that time period. Multiple time periods can be overlaid on the plot to allow comparison of the delays for different days and times.
Transit accessibility visualization tool

The transit accessibility visualization tool allows the user to see what bus stops can be accessed from a particular origin (depicted as black pin) in a specified amount of time. It can show accessibility based on published schedule (depicted in blue) or based on the realtime bus data for the specified date and time (depicted in red). The tool provides a powerful means of visualizing mobility on the bus network, as well as the impact that delays have on this mobility.
Crash Data Explorer
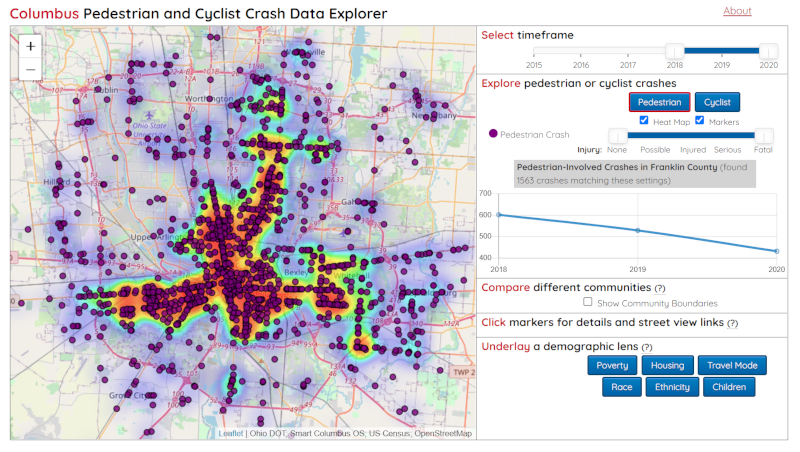
Columbus Crash Data Explorer is a web application that allows users to explore patterns of pedestrian and cyclist crashes in the Columbus metropolitan area and understand their connection to different communities and built environments.