Evidence of Increased Vehicle Speeding in Ohio's Major Cities during the Coronavirus Pandemic
Jinhyung Lee, Adam Porr and Harvey J. Miller
Center for Urban and Regional Analysis
The Ohio State University
1 May 2020
Contact: Harvey Miller
Email: miller.81@osu.edu
Phone: 614.292.5207
Background
Many cities in the United States are experiencing decreases in vehicular traffic during the coronavirus pandemic due to stay-at-home, social distancing, and other external or self-imposed isolation measures. However, many cities are also reporting dramatic increases in speeding (we post references to news articles at the end of this report).
The Center for Urban and Regional Analysis (CURA) investigated evidence for increased vehicle speeding using INRIX traffic data (https://inrix.com/) for Ohio's three biggest urbanized areas (UAs) Cleveland, Columbus and Cincinnati.
Comparing data for the dates March 28-April 19 in 2019 vs 2020, we find evidence of increased speeding in all three cities:
- Increases in the spatial extent of speeding based on mapping analysis
- Increases in average level of speeding based on statistical analysis
- Although the average increase in speeding is low, the levels of extreme speeding has increased dramatically based an analysis of the distribution of speeds in 2019 versus 2020.
Definition of speeding
Difference between average observed speed (for a given time period) and the INRIX reference speed. The reference speed is based on the typical free flow speed for the given road segment. These are not the actual posted speed limits, but are closely related to these posted limits.
https://en.wikibooks.org/wiki/Travel_Time_Reliability_Reference_Manual/INRIX_Data_Types
Data
1) Observed speed: INRIX real-time speed data.
- Before COVID-19: from 3/28 to 4/19 in 2019.
- After COVID-19: from 3/28 to 4/19 in 2020.
2) Reference speed. This is the "free-flow" travel speed for each segment. It is static.
Spatial patterns of speeding
1) Columbus Urbanized Area (UA)
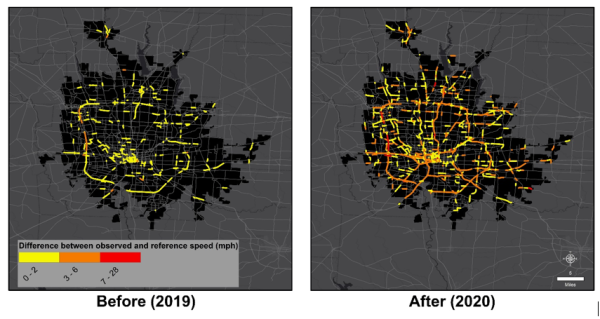
- Map interpretation example: “yellow” road segments mean their average observed speed during given time periods are 0-2 mph higher than the reference speed.
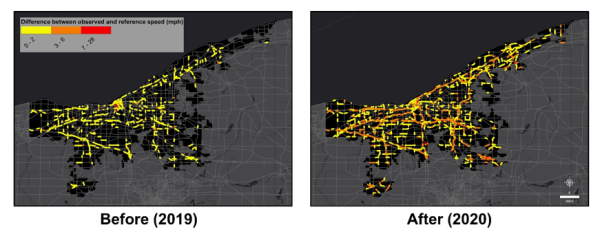
2) Cleveland UA
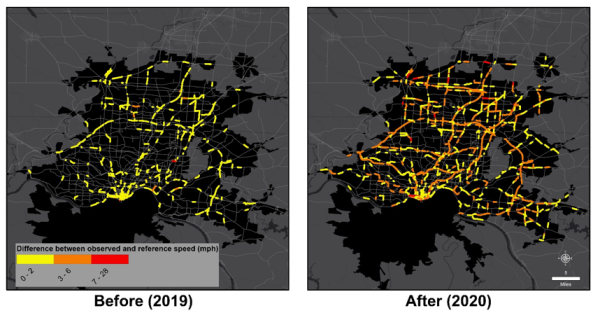
3) Cincinnati UA (Ohio part only)
Summary statistics for speeding
1) Columbus UA
Table 1 Speeding before and after COVID-19
| Before (2019) | After (2020) | |||||||
| % of speeding road segments | 17.8 | 57.0 | ||||||
| Minimum level of speeding (mph) | 0.0 | 0.0 | ||||||
| Maximum level of speeding (mph) | 5.1 | 28.0 | ||||||
| Average level of speeding (mph) | 0.8 | 2.5 |
2) Cleveland UA
Table 2 Speeding before and after COVID-19
| Before (2019) | After (2020) | |||||||
| % of speeding road segments | 20.1 | 54.2 | ||||||
| Minimum level of speeding (mph) | 0.0 | 0.0 | ||||||
| Maximum level of speeding (mph) | 23.3 | 11.0 | ||||||
| Average level of speeding (mph) | 1.0 | 2.1 |
3) Cincinnati UA (Ohio part only)
Table 3 Speeding before and after COVID-19
| Desciption | Before (2019) | After (2020) |
| % of speeding road segments | 18.4 | 48.3 |
| Minimum level of speeding (mph) | 0.0 | 0.0 |
| Maximum level of speeding (mph) | 13.7 | 22.5 |
| Average level of speeding (mph) | 0.8 | 2.7 |
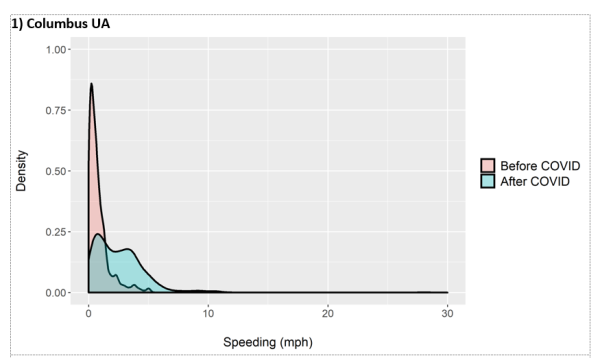
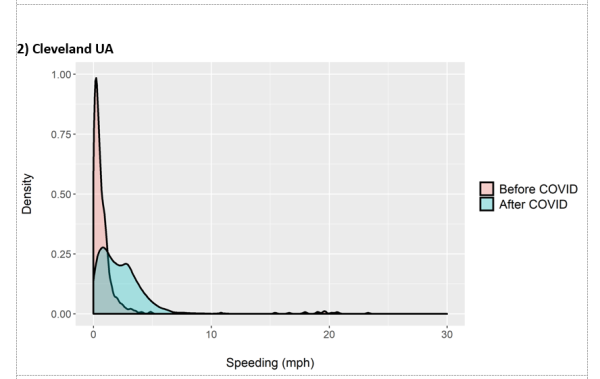
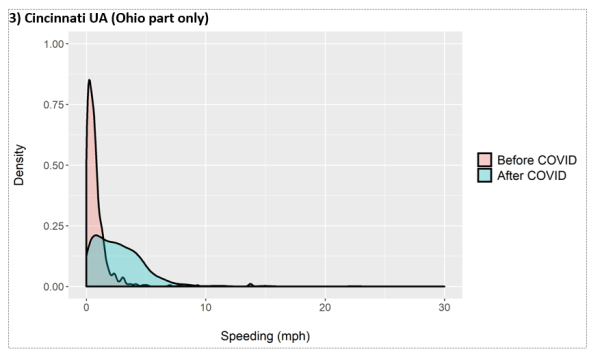
5. Speeding distributions
The following are density curves, showing the proportion of road segments showing with speeding levels over the historic free-flow (or reference) speed (indicated by "0" on the x-axis). This shows a clear shift toward greater speeding, as evidenced by the more spread out "After COVID" distribution, along with its shift to the right (towards greater speeding).
Statistical tests
* Question: Are the mean differences in speeding before and after COVID statistically significant?
* Methods: Welch’s T-test.
| City | T-value | P-value | ||||||
| Columbus UA | 23.498 | < 0.001 (very significant) | ||||||
| Cleveland UA | 10.266 | < 0.001 (very significant) | ||||||
| Cincinnati UA | 23.280 | < 0.001 (very significant) |
* Results: Mean differences in speeding before and after COVID are statistically significant in all three major urbanized areas in Ohio.
News articles about increased vehicular speeding during the coronavirus pandemic
- With fewer cars on the road, motorists are shifting into high gear -- driving 100 mph or more - https://www.cnn.com/2020/04/17/us/speeding-drivers-increase-coronavirus-trnd/index.html
- New York Streets Are Nearly Empty, but Speeding Tickets Have Doubled - https://www.nytimes.com/2020/04/16/nyregion/coronavirus-nyc-speeding.html
- As coronavirus empties streets, speeders hit the gas - https://www.reuters.com/article/us-health-coronavirus-autos-traffic/as-coronavirus-empties-streets-speeders-hit-the-gas-idUSKCN21X1GO
- Traffic deaths spike in Minnesota despite low vehicle volume https://www.mprnews.org/story/2020/04/09/traffic-deaths-spike-in-minnesota-despite-low-vehicle-volume