Evidence of housing price and neighborhood polarization in Columbus, Ohio
Jinhyung Lee, Nicholas Irwin, Elena Irwin, and Harvey J.
Miller
Center for Urban and Regional Analysis
The Ohio State University
15 May 2020
Contact: Harvey Miller
Email: miller.81@osu.edu
Phone: 614.292.5207
Summary
- Housing prices and neighborhood values are polarizing in Columbus, Ohio.
- Traditionally high-valued neighborhoods (e.g., Upper Arlington, Grandview Heights, and Bexley) are becoming richer while low-valued neighborhoods (e.g., Linden, Franklinton) are becoming poorer in terms of their housing prices and neighborhood values.
- A large georeferenced housing transactions database containing almost 480,000 parcel-level home sales from 2000 to 2015 was used for econometric modeling, mapping, and statistical analysis.
- This research has been published in Geographical Analysis: http://dx.doi.org/10.1111/gean.12238
Background
Urban spatial structure in the United States has been changing in recent decades. A notable trend is increasing social and spatial polarization among neighborhoods within the cities. For a better policy and planning implication, understanding how and where the urban polarization is happening is important.
To support this, the Center for Urban and Regional Analysis (CURA) investigated the spatial polarization of housing prices and neighborhood values in Columbus, Ohio, from 2000 to 2015 using a high resolution housing transactions database provided by CoreLogic (https://www.corelogic.com/).
Results
1. Housing price polarization
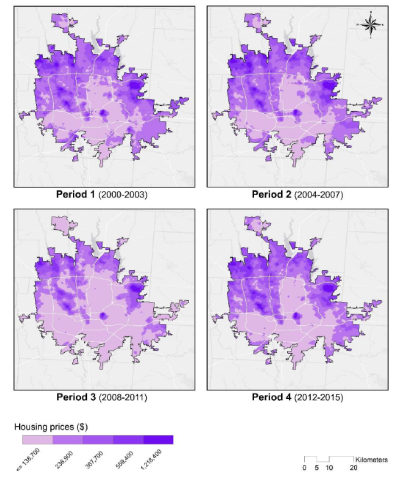
- High housing prices are generally clustered in the center of the Columbus UA (Upper Arlington, Grandview Heights, Bexley) and suburban areas.
- On the contrary, areas between the city center and suburban areas have low housing prices, resulting in a donut-shaped housing price landscape in the Columbus UA.
- The impacts of the Great Recession are shown in the maps of Period 2 and 3: housing prices significantly dropped throughout the city between Period 2 and 3, as they did throughout much of the United States.
- The Period 4 surface shows the recovery in housing prices after the Great Recession but the recovery did not happen equally across the city: areas that traditionally had high housing prices regained much of the recession-induced loss while other areas did not.
- This unequal recovery resulted in a binary and polarized geography of housing prices in the Columbus UA as presented in the Period 4 surface.
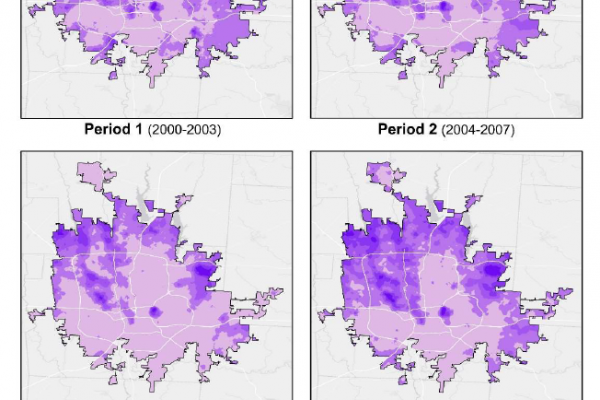
2. Neighborhood value polarization
- Neighborhood value measures the potential benefits and advantages of neighborhood location (manifested in housing prices).
- These benefits and advantages include proximity to natural (e.g., river, park), historical, and local-business (e.g., restaurants, theaters) amenities.
- Socio-economic characteristics such as crime/violence exposure, school quality, and social networks are also included in the neighborhood value.
- Demonstrating worsening and deepening spatial polarization in neighborhood values in the Columbus UA.
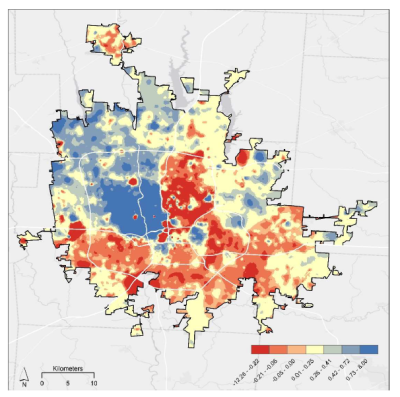
- Traditionally high-valued neighborhoods (e.g., Bexley, Grandview Heights, Upper Arlington) became richer (blue cells) while low-valued neighborhoods (e.g., Franklinton, Linden) became poorer (red cells) in terms of their neighborhood values.
- A particularly striking result is the east-west geographic divide of neighborhood values.
- The spatial polarization appears to be systematically related to the location of major highways within the UA and shows an especially sharp difference along US Interstate Highway 71
- This is consistent with work by public policy and urban history scholars
documenting that highways were constructed to purposefully cut through poorer,
minority neighborhoods and avoid more affluent ones, and have served to further
reinforce patterns of economic segregation.
Implications for policy makers and government officials
Our analysis results can provide important insights to government officials, urban planners, and policymakers, allowing for optimal policy to be implemented in an effort to mitigate urban inequality issues.
Possible reactions include direct investments in low-valued neighborhoods that can spark a self-reinforcing development process.
For example, our analysis can help to justify purposeful public policy and service program investments (e.g., job market training program) in low-valued neighborhood locations to offset the self-reinforcing effects that can otherwise make these neighborhoods worse off over time.